Solved Problem on Center of Mass
advertisement
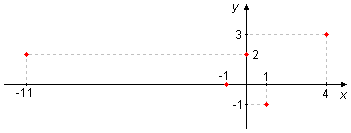
We have the following distribution of masses in the xy-plane: m1 = 2 kg at position (1, -1), m2 = 3 kg at (0, 2), m3 = 1 kg at (-1,0), m4 = 2 kg at (4, 3) and m5 = 7 kg at (-11, 2). Determine the coordinates of the center of mass of this distribution and plot a graph.
Problem data:
| mass (kg) | position (x, y) | |
|---|---|---|
| 1 | 2 | (1, -1) |
| 2 | 3 | (0, 2) |
| 3 | 1 | (-1, 0) |
| 4 | 2 | (4, 3) |
| 5 | 7 | (-11, 2) |
Table 1
Problem diagram:
Solution
The Center of Mass is given by
\[
\begin{gather}
\bbox[#99CCFF,10px]
{{\vec{r}}_{cm}=\frac{\sum m_{i}{\vec{r}}_{i}}{m_{i}}}
\end{gather}
\]
writing the components
\[
\begin{gather}
x_{cm}=\frac{\sum m_{i}x_{i}}{m_{i}}
\end{gather}
\]
\[
\begin{gather}
y_{cm}=\frac{\sum m_{i}y_{i}}{m_{i}}
\end{gather}
\]
substituting the data
\[
\begin{gather}
x_{cm}=\frac{2\times 1+3\times 0+1\times (-1)+2\times 4+7\times (-11)}{2+3+1+2+7}\\[5pt]
x_{cm}=\frac{2+0-1+8-77}{15}\\[5pt]
x_{cm}=\frac{-68}{15}\\[5pt]
x_{cm}\simeq -4,5
\\[10pt]
y_{cm}=\frac{2\times (-1)+3\times 2+1\times 0+2\times 3+7\times 2}{2+3+1+2+7}\\[5pt]
y_{cm}=\frac{-2+6+0+6+14}{15}\\[5pt]
y_{cm}=\frac{24}{15}\\[5pt]
y_{cm}=1,6\
\end{gather}
\]
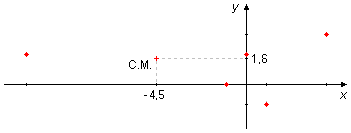
The coordinates of the center of mass are
\[
\begin{gather}
\bbox[#FFCCCC,10px]
{\left(x_{cm};y_{cm}\;\right)=\left(-4.5,1.6\right)}
\end{gather}
\]
plotting the graph
advertisement

Fisicaexe - Physics Solved Problems by Elcio Brandani Mondadori is licensed under a Creative Commons Attribution-NonCommercial-ShareAlike 4.0 International License .